안녕하세요.
오픈소스 pypipo 메인테이너 입니다.
pypipo 란?
어떤 이미지를 자동으로 피포페인팅 캔버스로 변환해주는 영상처리 기술 기반의 라이브러리
Github
https://github.com/AutoPipo/pypipo
GitHub - AutoPipo/pypipo: Python Library based on EasyPipo
Python Library based on EasyPipo. Contribute to AutoPipo/pypipo development by creating an account on GitHub.
github.com
지금부터 어떻게 이미지가 피포페인팅 캔버스로 변환되는지 그 과정에 대해 서술하려 합니다.
모든 image processing 알고리즘은 Github 내 libs/process.py 에 있습니다.
1. 이미지 그림화 (Painting)
첫번째로 실제 이미지를 그림처럼 변경해주는 과정입니다.
결국 물감으로 캔버스에 칠했을때, 실제 그림으로 완성되어야 하니
결과물이 되는 결과이미지를 만들어두는 과정입니다.


위 그림에서 좌측이 원본, 우측이 그림처럼 변경된 결과 이미지 입니다.
여기서는
1. 이미지 흐림처리 Blurring
2. 이미지 내 색상 줄이기 K Means
두 가지 영상처리 기술을 활용했습니다.
Blurring
Bilateral Filter 메서드를 활용했습니다.
Bilateral 흐름 효과는 cv2 메서드 중에서 가장자리를 가장 잘 살려주는 흐름효과 입니다.
오픈소스의 목적이 그림을 그리기 위한 캔버스 제작이니, Bilateral 필터를 적용시킵니다.
Reducing Color
여기서는 K Means 알고리즘을 통해 이미지 내 수만가지 색상을 K개로 줄이는 과정을 거쳤습니다.
그리고 실제 모든 픽셀의 이미지에서 K개의 색상중 색상 거리(color distance, 유클리드 거리)가 가장 가까운 색을 선택하여 변경해줍니다.
소스코드
# 이것은 Painting process의 일부 핵심 소스코드 입니다.

     def __blurring(self, div, sigma):
        """Image blurring

        Parameters
        ----------
        div : int
            Reducing numbers of color on image
        sigma : int
            bilateralFilter Parameter

        Returns
        -------
        blurred_image : np.ndarray
            blurred Image
        """

        BILATERAL_FILTER_RADIUS = -1  # Auto decision by sigmaSpace
        BILATERAL_FILTER_SIGMACOLOR_MIN = 10
        BILATERAL_FILTER_SIGMACOLOR_MAX = 120

        qimg = self.original_img.copy()  # copy original image

        sigma = max(sigma, BILATERAL_FILTER_SIGMACOLOR_MIN)
        sigma = min(sigma, BILATERAL_FILTER_SIGMACOLOR_MAX)

        # bilateral blurring
        blurred_image = cv2.bilateralFilter(qimg, BILATERAL_FILTER_RADIUS, sigma, sigma)

        # reduce numbers of color
        blurred_image = blurred_image // div * div + div // 2
        return blurred_image

    def __cluster_color_with_kmeans(self, image, number_of_color, attempts):
        """Cluster image color with k-means algorithm.

        Parameters
        ----------
        image : np.ndarray
            Input image
        number_of_color : int
            Number of color clustered
        attempts : int
            How many iterate try to k-means clustering

        Returns
        ----------
        color_clustered_image : np.ndarray
            Color clustered image
        color_index_map : np.ndarray
            a Array that contains clustered color indexs.
        """
        height, width = image.shape[:2]

        # transform color data to use k-means algorithm
        # need to trnasform into two-dimensional array
        # [[B, G, R], [B, G, R] ... , [B, G, R]]
        training_data_samples = image.reshape((height * width, 3)).astype(np.float32)

        # sse : Sum of squared error
        # labels : Array about label, show like 0, 1
        # centers : Cluster centroid array
        sse, labels, centers = cv2.kmeans(
                                        training_data_samples,  # Align training data, data type = np.float32
                                        number_of_color,        # number of cluster
                                        None,                   # Sort the cluster numbers for each sample

                                        # TERM_CRITERIA_EPS : End iteration when a certain accuracy is reached
                                        # TERM_CRITERIA_MAX_ITER : End iteration after a certain number of iterations
                                        criteria = (cv2.TERM_CRITERIA_EPS + cv2.TERM_CRITERIA_MAX_ITER,
                                                    100000, # max_iter : Max number of iterations
                                                    0.0001), # epsilon : Specific Accuracy Required
                                        attempts = attempts,  # Number of iterations to run using different initial centroids

                                        # flags : To set the Initial Centroids
                                        # cv2.KMEANS_RANDOM_CENTERS : Random
                                        # cv2.KMEANS_PP_CENTERS : K-Means++ Algorithm
                                        # cv2.KMEANS_USE_INITIAL_LABELS : User selection
                                        flags = cv2.KMEANS_PP_CENTERS)

        # a Array that contains clustered color indexs.
        # it has same shape as Oringinal image, but the value it contains is a single-dimension.
        # it will be used to draw line along the colors.
        color_index_map = labels.reshape((height, width))

        centers = np.uint8(centers)
        res = centers[labels.flatten()]
        self.clustered_colors = centers

        # for returns
        sse = round(sse ** 0.5 // 10, 2)
        color_clustered_image = res.reshape((image.shape))
        return color_clustered_image, color_index_map
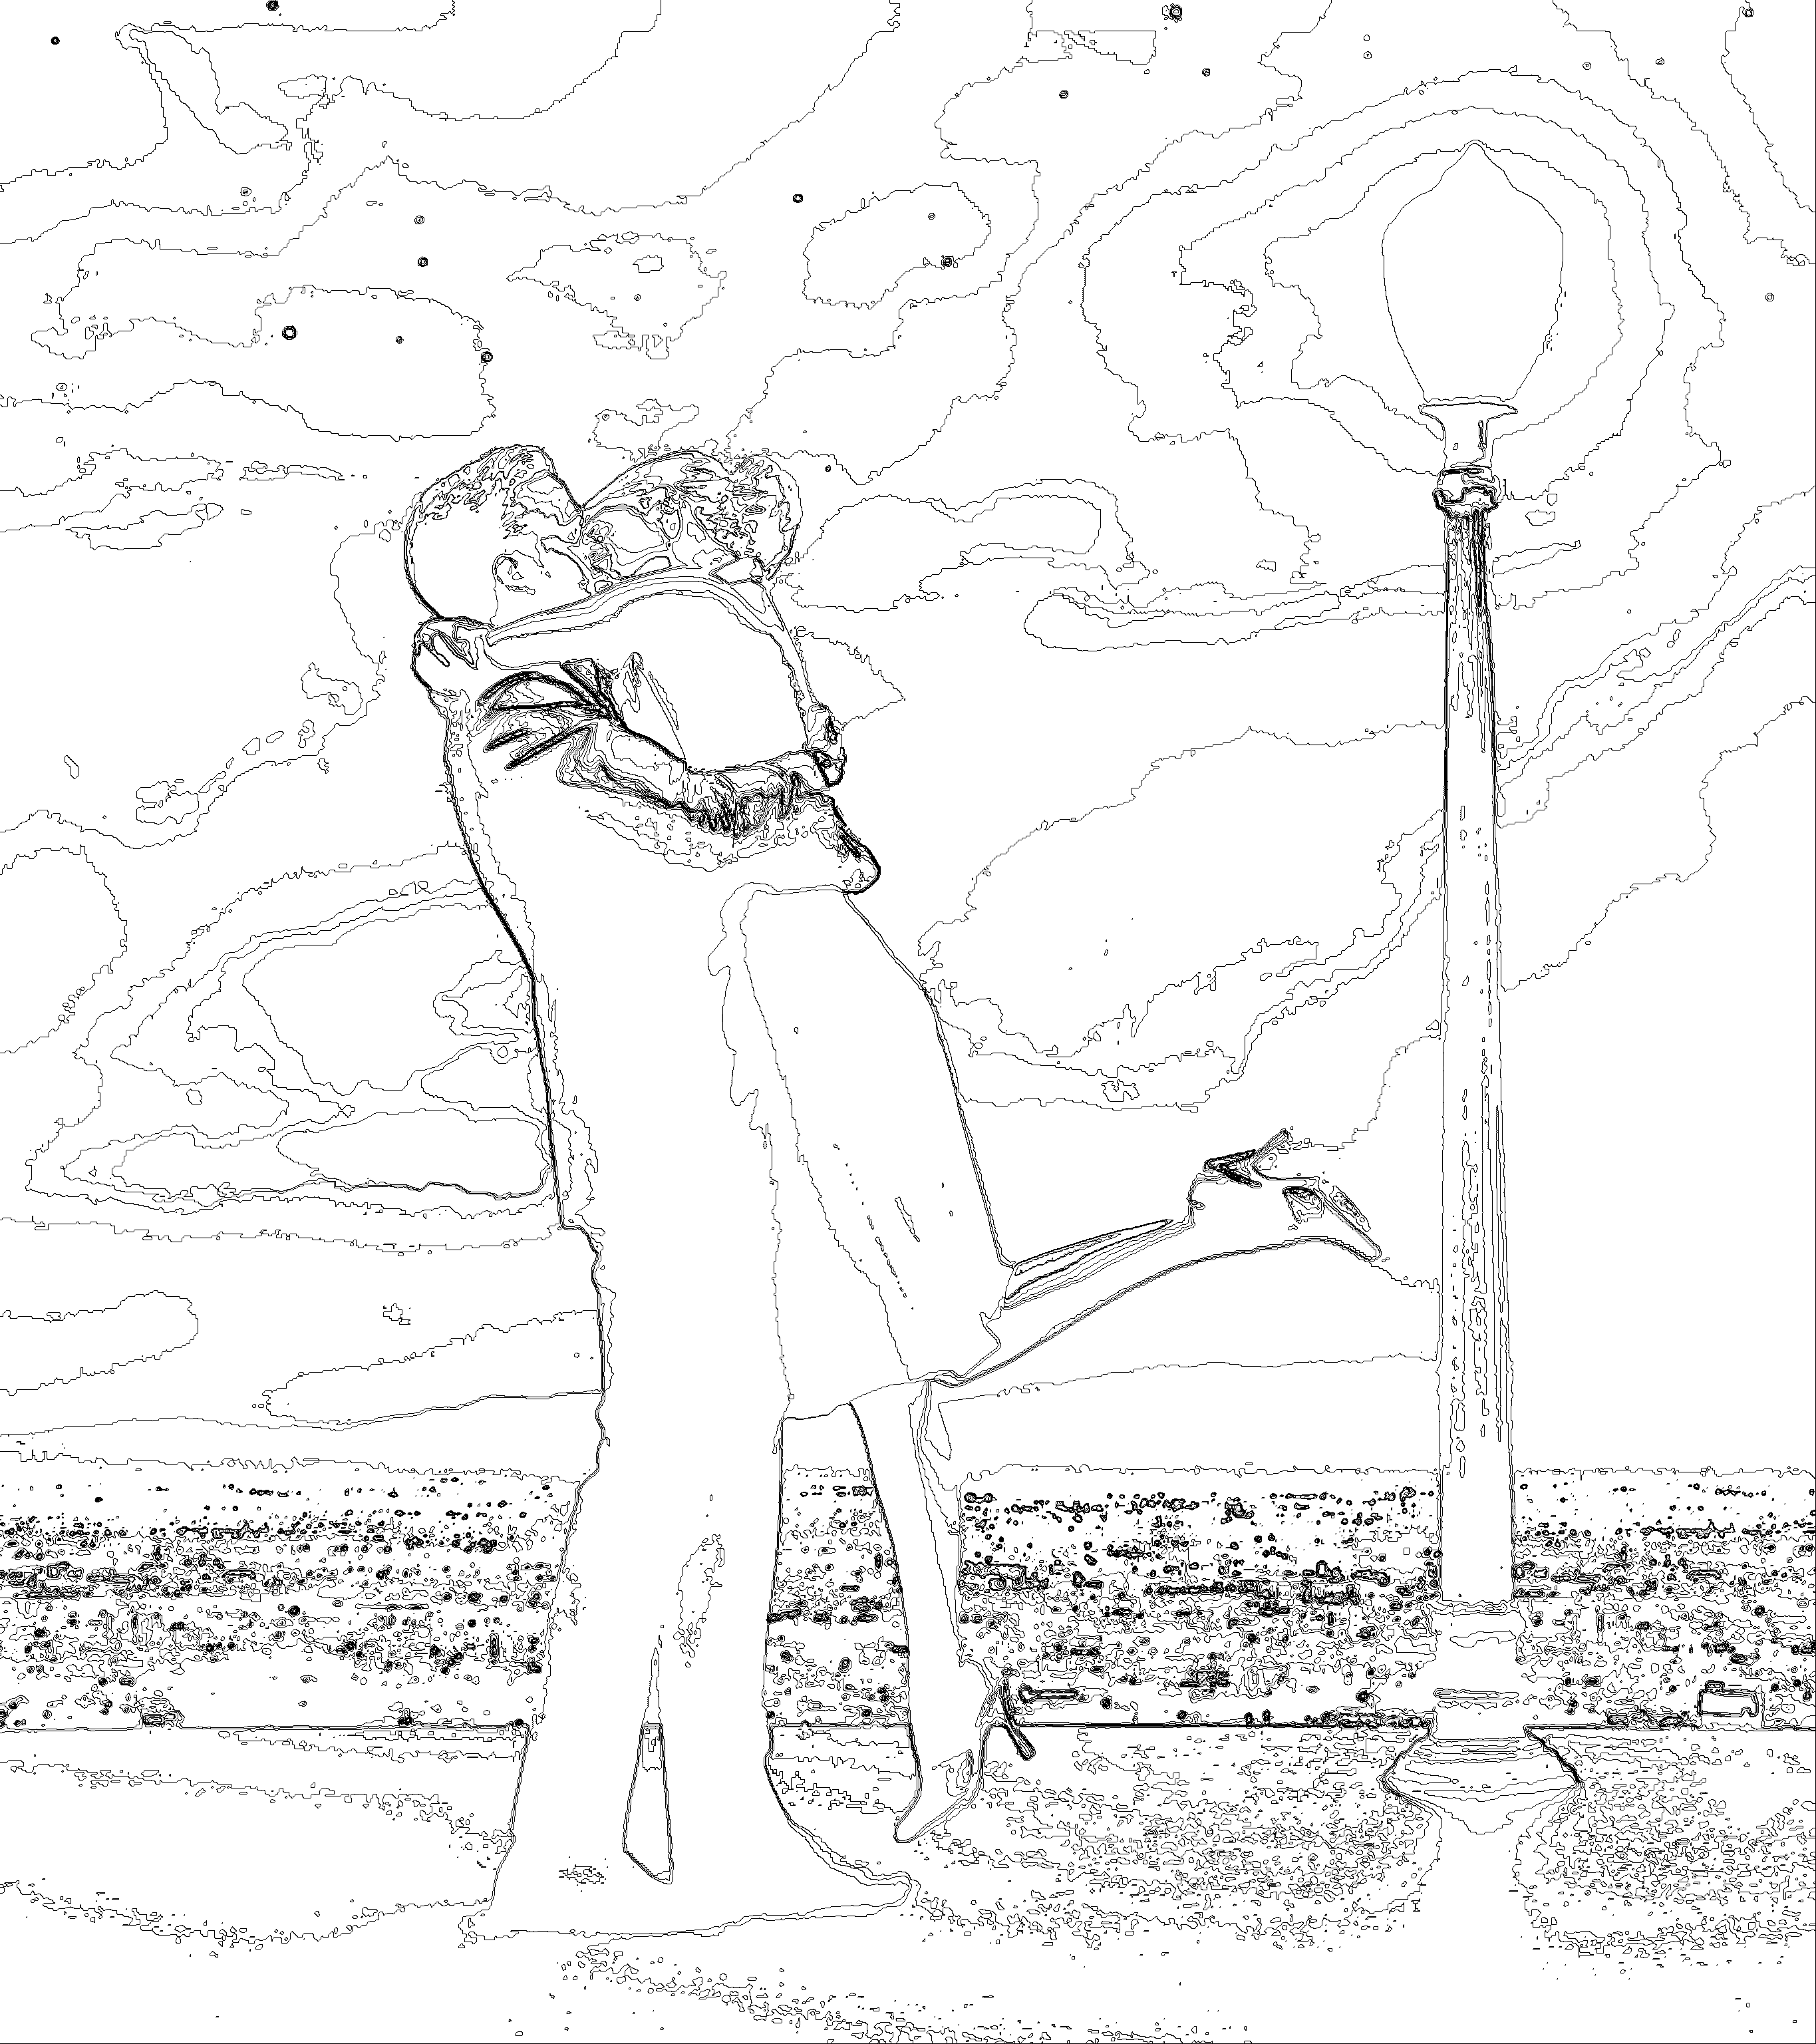
2. 선 그리기 (Drawing)
이 과정은 앞서 1번에서 설명한 그림처럼 변경된 이미지를 기반으로
모든 픽셀에 대해 색상값을 기준으로 색상이 변경되는 부분에 점을 찍어주어 경계선을 그려주는 과정입니다.
1번에서 우리는 (픽셀 xy 좌표, 색상값) 정보를 얻을 수 있습니다.
여기서 모든 색상값을 기준으로 같지않으면 검은색으로 채워주는 아주 간단한 과정입니다.
그 결과는 아래와 같습니다.
굉장히 지저분한 부분이 많습니다. 우리는 다음 과정에서 지저분한 라인을 제거해줄 것입니다.
소스코드
    def __draw_line(self):
        """Draw line with color boundary from painting image

        Parameters
        ----------
        painting : np.ndarray
            Input painting image

        Returns
        ----------
        web : np.ndarray
            Gray scale image that line drawn
        """

        # Find color index difference by comparing row and columns.
        hor_diff = self.__get_diff(self.color_index_map)
        ver_diff = self.__get_diff(self.color_index_map.T)

        # rotate 90 degree to fit shape with hor_diff
        ver_diff = ver_diff.T

        # merge horizontal and vertical difference by element-wise operation
        diff = ver_diff + hor_diff

        # set pixel color to black if there is a difference
        web = np.where(diff != 0, self.BLACK_COLOR, self.WHITE_COLOR)
        return web


    def __get_diff(self, map):
        """Draw outline on image
        Parameters
        ----------
        map : np.ndarray
            a array that contains simplified color index

        Returns
        ---------
        diff : np.ndarray
            a array that contains each row value diffences.
        """

        diff = np.zeros(map.shape) + self.WHITE_COLOR

        # subtracts current row and next row
        for y, row in enumerate(map[:-1]):
            next_row = map[y + 1]
            diff[y] = row - next_row

        return diff
3. 색상 인덱스 붙이기 (Numbering)
우리는 위 과정에서 색상을 k개로 구분하고, 색상 구분선을 그려주었습니다.
이때, 하나의 연결된 선들의 집합을 contours라고 부릅니다.
그럼 contours 내부에는 각각 하나의 색상만이 존재하게 됩니다.
실제로 피포페인팅에서 물감을 색칠하기 위해서는 숫자를 보고 매칭해야 합니다.
그래서 여기서는
각각 contours 내부에 알맞는 색상 번호(Index)를 적어주는 작업을 합니다.
여기서 가장 중요한 것은
번호를 contour 어느 위치에 찍어줘야할까? 라는 질문에 대한 대답입니다.
먼저 우리는 내접원을 구상했습니다.
하지만 내접원도 모든 경우를 해결해줄 수 없었습니다.
문제 상황 예시
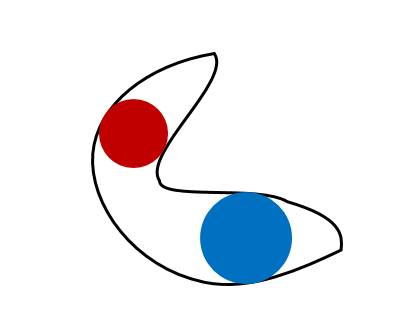
왼쪽 그림은에서 내접원은 굉장히 다양하게 존재합니다.
그중 빨간원은 내접원이지만 최대반지름이 아닙니다.
최대 반지름인 파란 원을 찾아야 합니다.
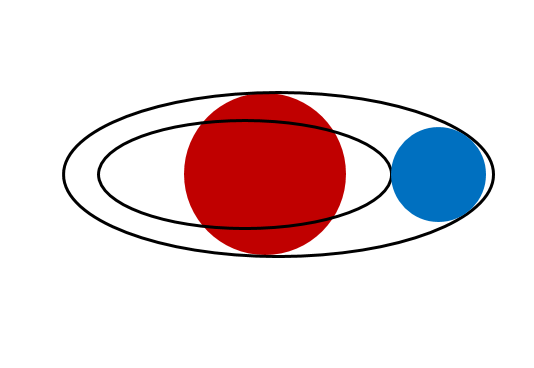
오른쪽 그림은 빨간원이 가장 큰 반지름을 가진 내접원입니다.
하지만 contour가 겹쳐있어 내접원의 중심에 번호를 기입하게될 경우, 다른 contour에 기입되게 됩니다.
우리는 자식 contour를 제외한 면적중에서 내접원을 찾아야하고, 그게 파란 원입니다.
위와 같은 이슈를 해결하기 위해
각 contour를 별도로 계산하기로 합니다.
이미지서 자식 contour를 다른 색상으로 칠해주고, 남은 면적중에서의 내접원의 중심을 구해줍니다.
cv2.distanceTransform() 메서드를 이용하기로 합니다.
OpenCV distanceTransform() 함수는 이미지에서 0이 아닌 각 픽셀과 가장 가까운 0 픽셀 사이의 유클리드 거리를 계산하는 이미지 처리 함수 라고 합니다.
위 함수를 통해
우리는 원하는 기능을 성공적으로 구현할 수 있었습니다.
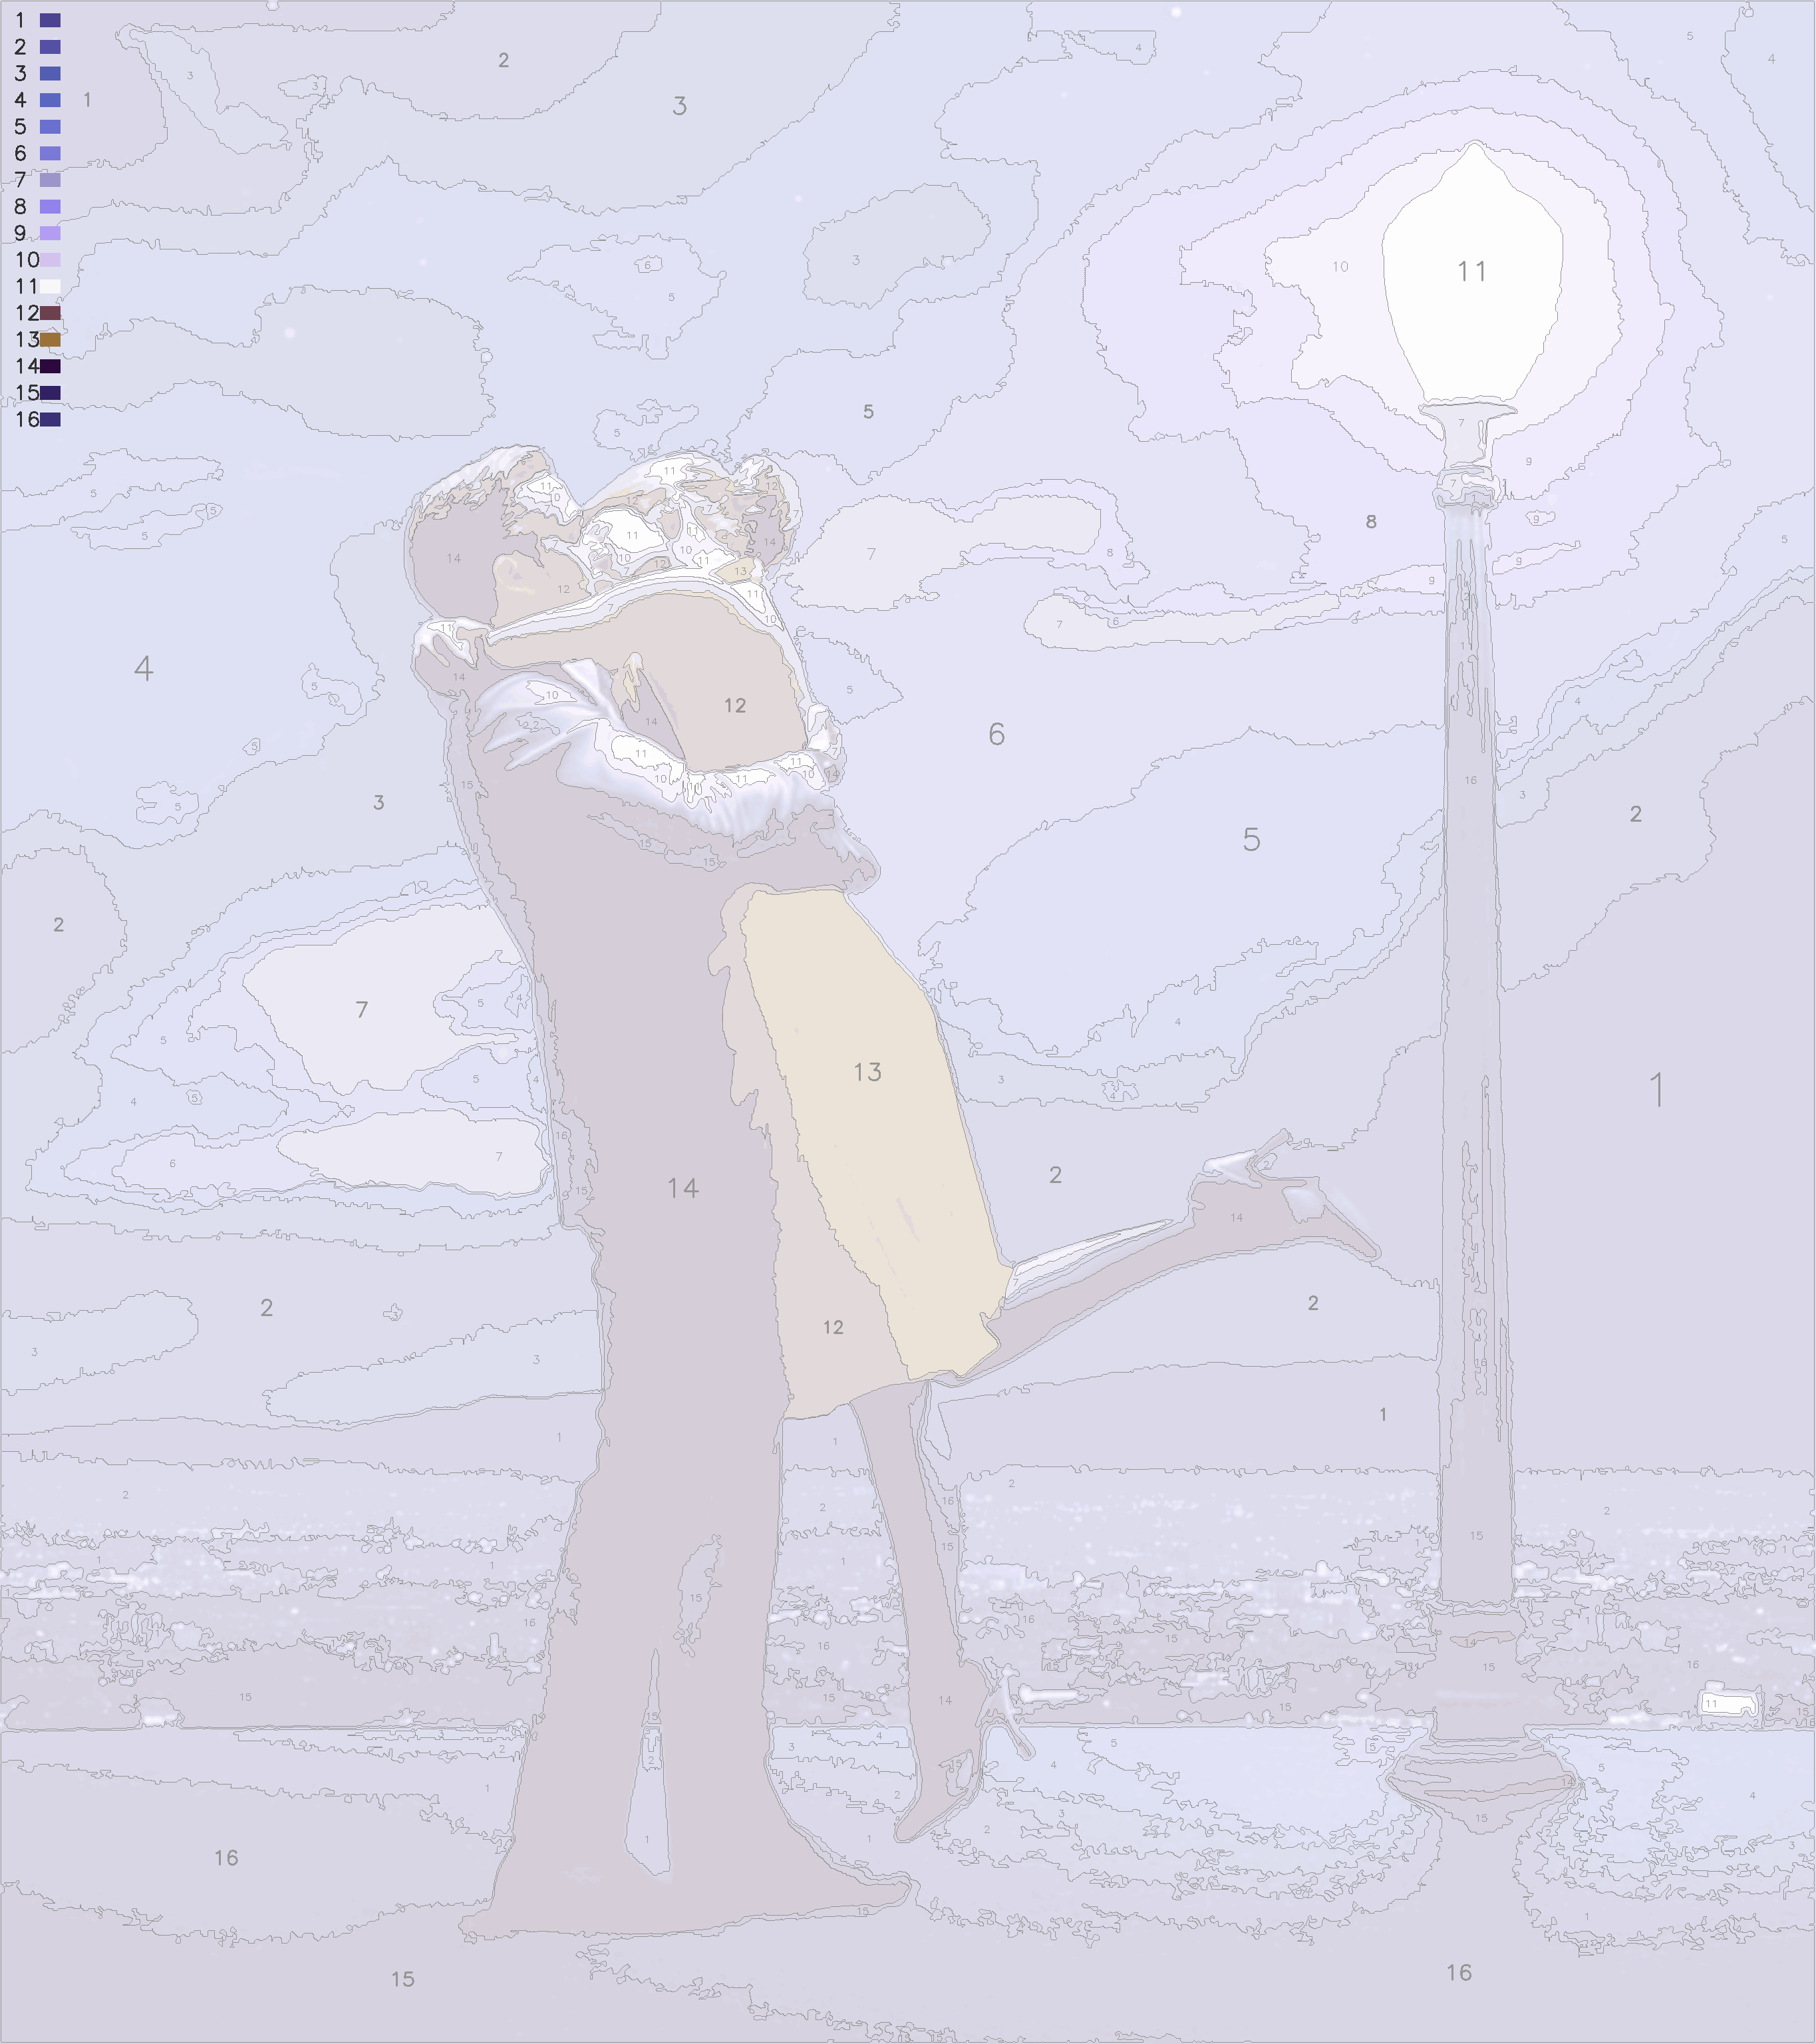
물론 위와 같은 최종 결과 이미지는
기존 생성한 결과 이미지를 투명하게하여 뒤에 입히고
좌측 상단에 color label을 추가해주었습니다.
소스코드
    def __get_contours_information_from_web(self, web_image):
        """Get contours, hierarchy, image_bin from web image

        Parameters
        ----------
        web_image : np.ndarray
            Line drawn image
        """
        web_image = web_image.astype(np.uint8)  # have to convert grayscale
        _, image_bin = cv2.threshold(web_image, 127,255, cv2.THRESH_BINARY_INV)
        contours, hierarchy = cv2.findContours(image_bin.copy(), cv2.RETR_TREE, cv2.CHAIN_APPROX_NONE)
        return contours, hierarchy, image_bin

    def __get_circle_radius_center(self, raw_dist):
        '''Get inner circle radius, center coordinates

        Parameters
        ----------
        raw_dist : np.ndarray
            @@@

        Returns
        ----------
        radius : float
            Radius of inner circle
        center : tuple
            Center coordinate of inner circle
        '''
        dist_transform, _ = cv2.distanceTransformWithLabels(raw_dist, cv2.DIST_L2, maskSize=5)
        _, radius, _, center = cv2.minMaxLoc(dist_transform)
        return radius, center


    def __numbering_colorspace_from_contours(self,
                                             background_img,
                                             image_bin,
                                             contours,
                                             hierarchy,
                                             img_lab,
                                             lab):
        '''looping contours list, and put color index label in each contour.

        Parameters
        ----------
        background_img : np.ndarray
            Background image
        image_bin : np.ndarray
            @@@
        contours : tuple
            @@@
        hierarchy : np.ndarray
            @@@
        img_lab : np.ndarray
            @@@
        lab : np.ndarray
            @@@

        Returns
        ----------
        background_img : np.ndarray
            Image that filled color index string each contours.
        '''
        # TODO: more faster
        for idx in trange(len(contours), file=sys.stdout, desc='Numbering Process'):
            contour = contours[idx]

            # Ignore areas below a certain size
            if cv2.contourArea(contour) < self.NUMBERING_MIN_AREA:
                continue

            chlidren = [i for i, hierarchy_obj in enumerate(hierarchy[0]) if hierarchy_obj[3] == idx]

            raw_dist = np.zeros(image_bin.shape, dtype=np.uint8)
            cv2.drawContours(raw_dist, contour, -1, (255, 255, 255), 1)
            cv2.fillPoly(raw_dist, pts =[contour], color=(255, 255, 255))
            cv2.fillPoly(raw_dist, pts =[contours[i] for i in chlidren], color=(0, 0, 0))

            radius, center = self.__get_circle_radius_center(raw_dist)

            # Ignore radius below a certain length
            if radius < self.NUMBERING_MIN_RADIUS:
                continue

            if center is not None:
                cv2.drawContours(background_img, [contour], -1, (150, 150, 150), 1)

                # 내접원 확인용(주석 풀면 활성화)
                # cv2.circle(img, center, int(radius), (0, 255, 0), 1, cv2.LINE_8, 0)

                # Show the color detected inside the contour
                color_text = self.check_avg_color_inside_colorspace(img_lab, contour, lab)

                center_point = (center[0], center[1])
                self.__set_label_inside_colorspace(background_img, color_text, center_point, radius)

        return background_img
이로서 pypipo 라이브러리의 image processing 수행과정은 모두 끝입니다.
컨튜리뷰션
pypipo 오픈소스 컨튜리뷰션에 참여해주실 분은 언제든지 댓글 남겨주십시오
혹은 위에 적어둔 Github Issue에 등록해주셔도 확인이 가능합니다.
'Open Source 개발' 카테고리의 다른 글
| [Visual Python] 오픈소스 컨트리뷰션 - 틈새 시장을 노려라 (0) | 2023.10.22 |
|---|---|
| [Visual Python] 오픈소스 컨트리뷰션 - 새로운 기능 추가하기 (0) | 2023.08.27 |
| [Visual Python] 오픈소스 컨트리뷰션을 위한 개선점 찾기 (0) | 2023.08.05 |
| [오픈소스 개발기] 내가 만든 오픈소스 pip 등록하기 (0) | 2023.07.10 |
| [오픈소스 개발기] pypipo : CLI 만들기 (0) | 2023.07.08 |